
The 55+ housing market is constantly evolving, with trends shifting throughout the year. These changes can signal price fluctuations, shifts in supply and demand, and increased competition. By staying informed on market trends, you can better anticipate opportunities and make strategic decisions about when to buy or sell.
To help you navigate the latest developments, we’ve analyzed the top changes in the 55+ housing market over the past year. Our comprehensive guide breaks down key factors like inventory levels, sales activity, and price trends—plus what they could mean for buyers and sellers in 2025.
Inventory Levels in the 55+ Market

One key trend to watch while house hunting is a market’s months of inventory (MOI). The MOI is an estimate of the average number of months it would take to sell all the houses currently on the market in a given area. Paying attention to the MOI is a good way to gauge whether or not housing prices are likely to increase or decrease, which can help you determine when it’s the right time to buy or sell.
Increase in Months of Inventory (MOI)
When a market sees an increase in its MOI, it usually means houses are taking longer to sell. The increase could be caused by a variety of reasons, including an influx of houses going on the market at the same time without the same level of demand. It can also be a sign that the market is cooling off, giving buyers more of an advantage over sellers.
A high MOI can work in a buyer’s favor, as a saturated market offers more housing options and lower prices, providing them with greater negotiating power and value for their money. It can also allow buyers the added luxury of having plenty of time to find the perfect home that best fits their lifestyle and budgetary needs—something you won’t typically get in more competitive markets where you’ll have to make very quick decisions.
Decrease in Months of Inventory (MOI)
A decrease in an area’s MOI is typically a strong indicator that the market is heating up and gaining traction. Both buyers and investors should pay close attention when this happens as properties are likely to start selling more quickly in the area.
With fewer homes available, competition among buyers increases, forcing them to act quickly if they’re serious about purchasing a property because it likely won’t be on the market long. Low inventory combined with high demand in a market will often drive housing prices higher, giving sellers an advantage over buyers in the area.
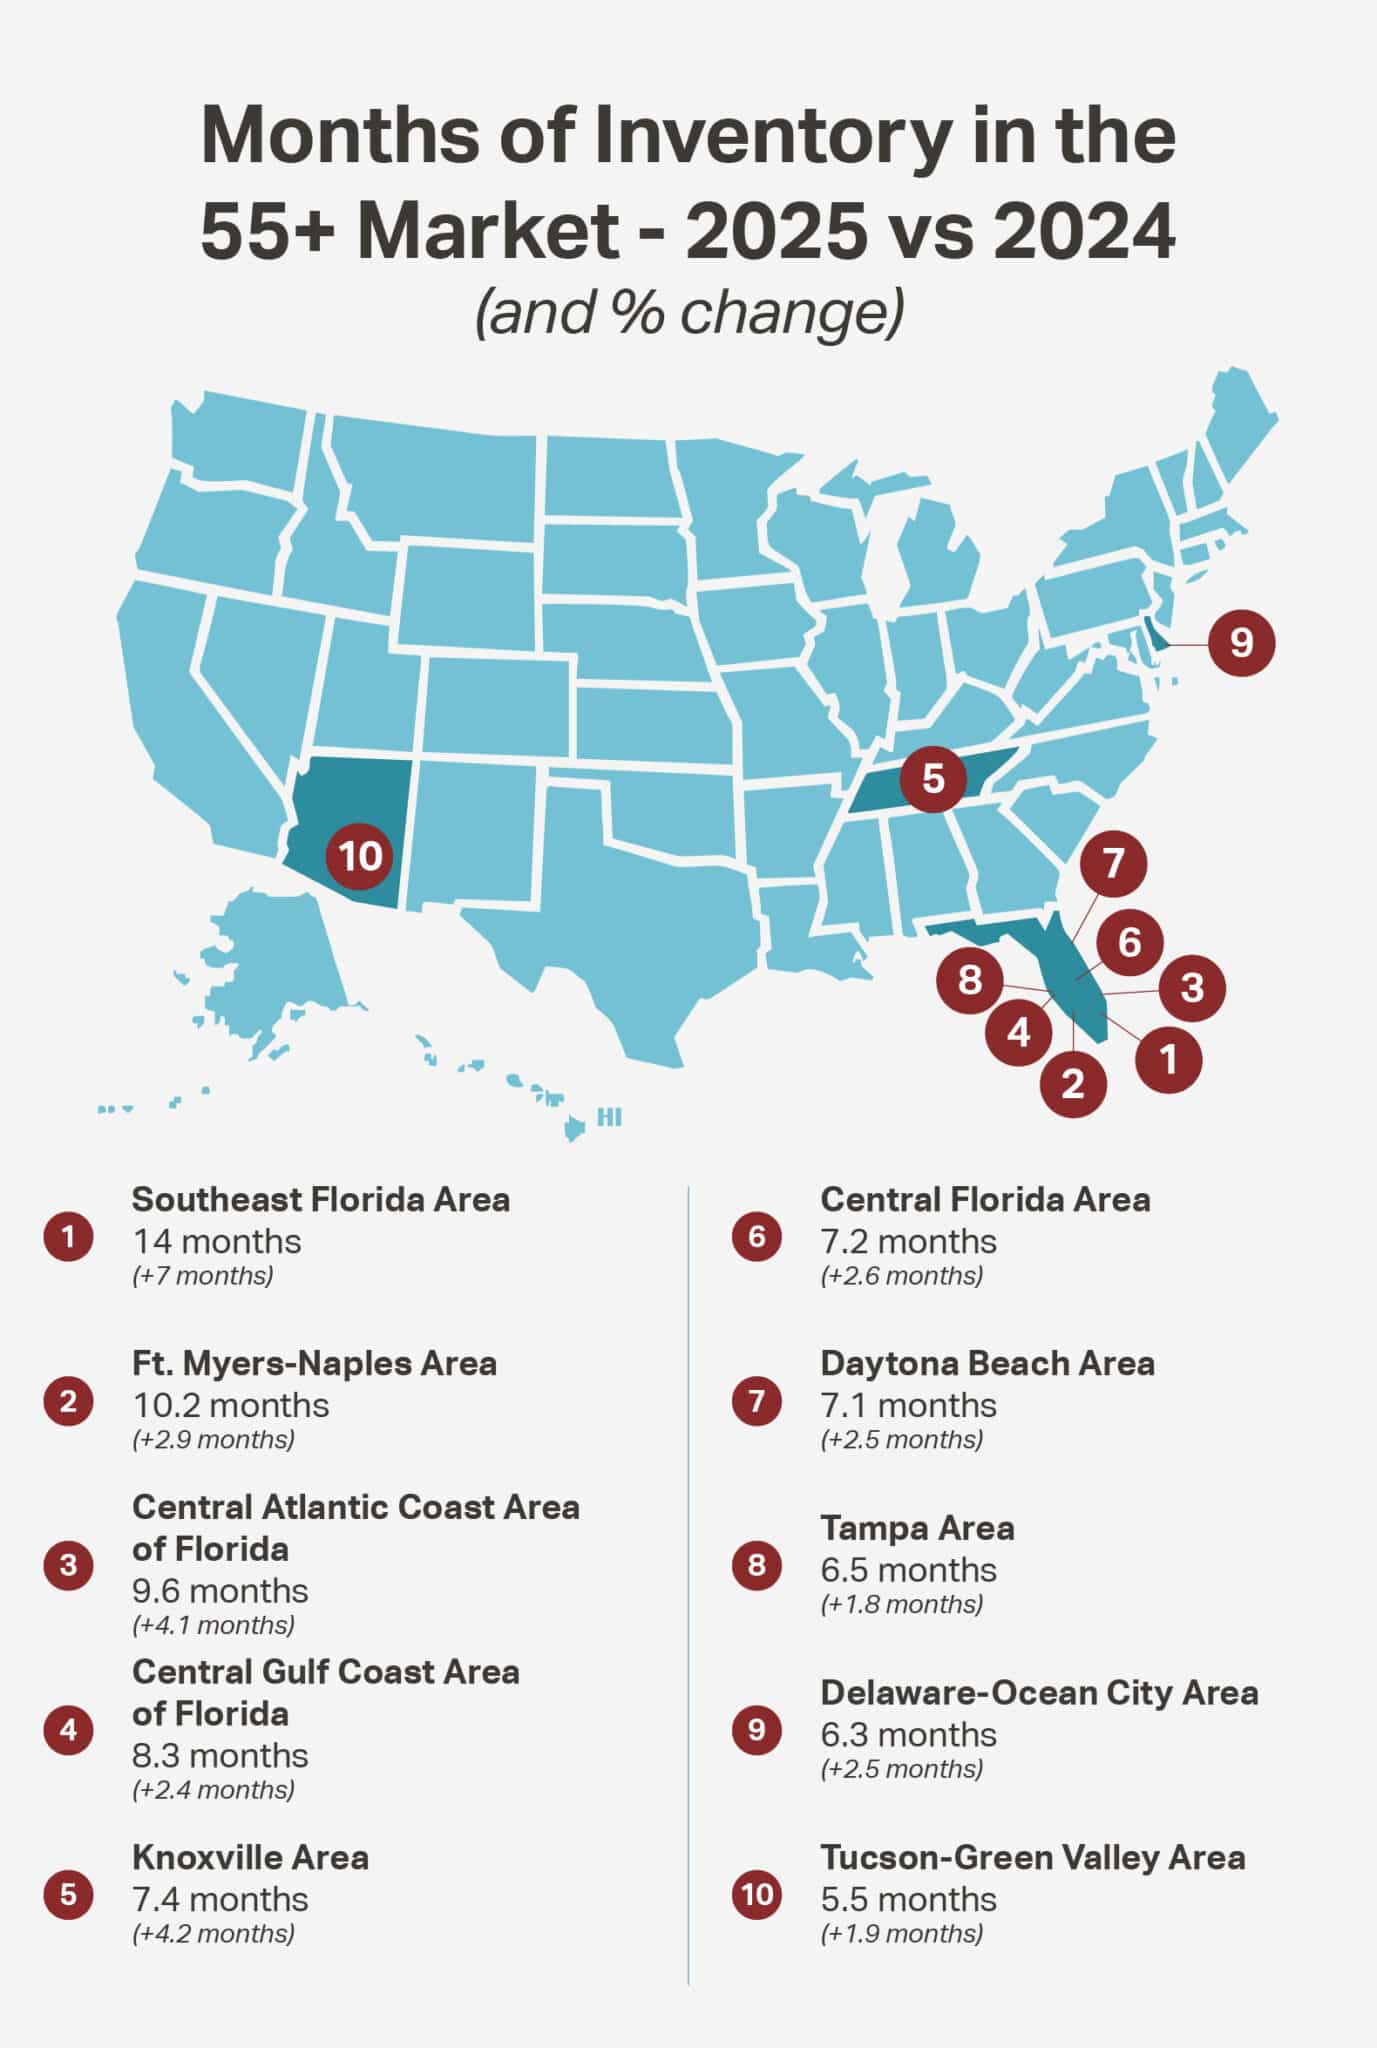
Here’s a look at the top 10 55+ markets that saw the largest increase in MOI over the last year:
Regional Trends in Inventory Growth
Florida
Florida dominated the list of the top 10 markets with the largest inventory increases. These high levels of available inventory are somewhat surprising as Florida frequently ranks as one of the top retirement destinations in the country, especially among snowbirds. But the increase could be beneficial for retirees looking to buy in the Sunshine State if the excess leads to prices dropping in areas like Southeast Florida, which saw the highest increase in MOI in the country at a total of 14.01 months.
Knoxville, TN
Knoxville, TN is another 55+ market that’s seen an increase in its MOI recently. The city’s MOI has increased to 7.4 months and the average number of homes on the market doubled from 151 active listings to 302 listings over the last year.
The spike is primarily driven by the area’s growing appeal among active adults for its affordable cost of living, variety of cultural amenities, and access to outdoor recreation options. As the city has become more popular with retirees, the number of new construction homes has also increased, leading to a rise in the market’s MOI.
Demand for New Construction
While an increase in MOI can be favorable for buyers looking to score a great deal on a home, the shift can negatively impact new construction and development in an area. When a market is oversaturated, typically the demand for new construction homes decreases, often leading to builders slowing down or canceling current projects.
Closing Activity Surges in Key Markets
In the real estate industry, “closing” refers to the final stages of the homebuying process where the seller receives payment and ownership of the property is transferred to the buyer. Reaching the point of closing on a home can often be a lengthy process, so when a market experiences an increase in closings, it’s usually a signal to buyers that the area is heating up and gaining popularity. This surge will often lead to increased competition within the market, which in turn drives up housing prices and leaves potential buyers with less room to negotiate. Closing activity surges work in favor of the seller.
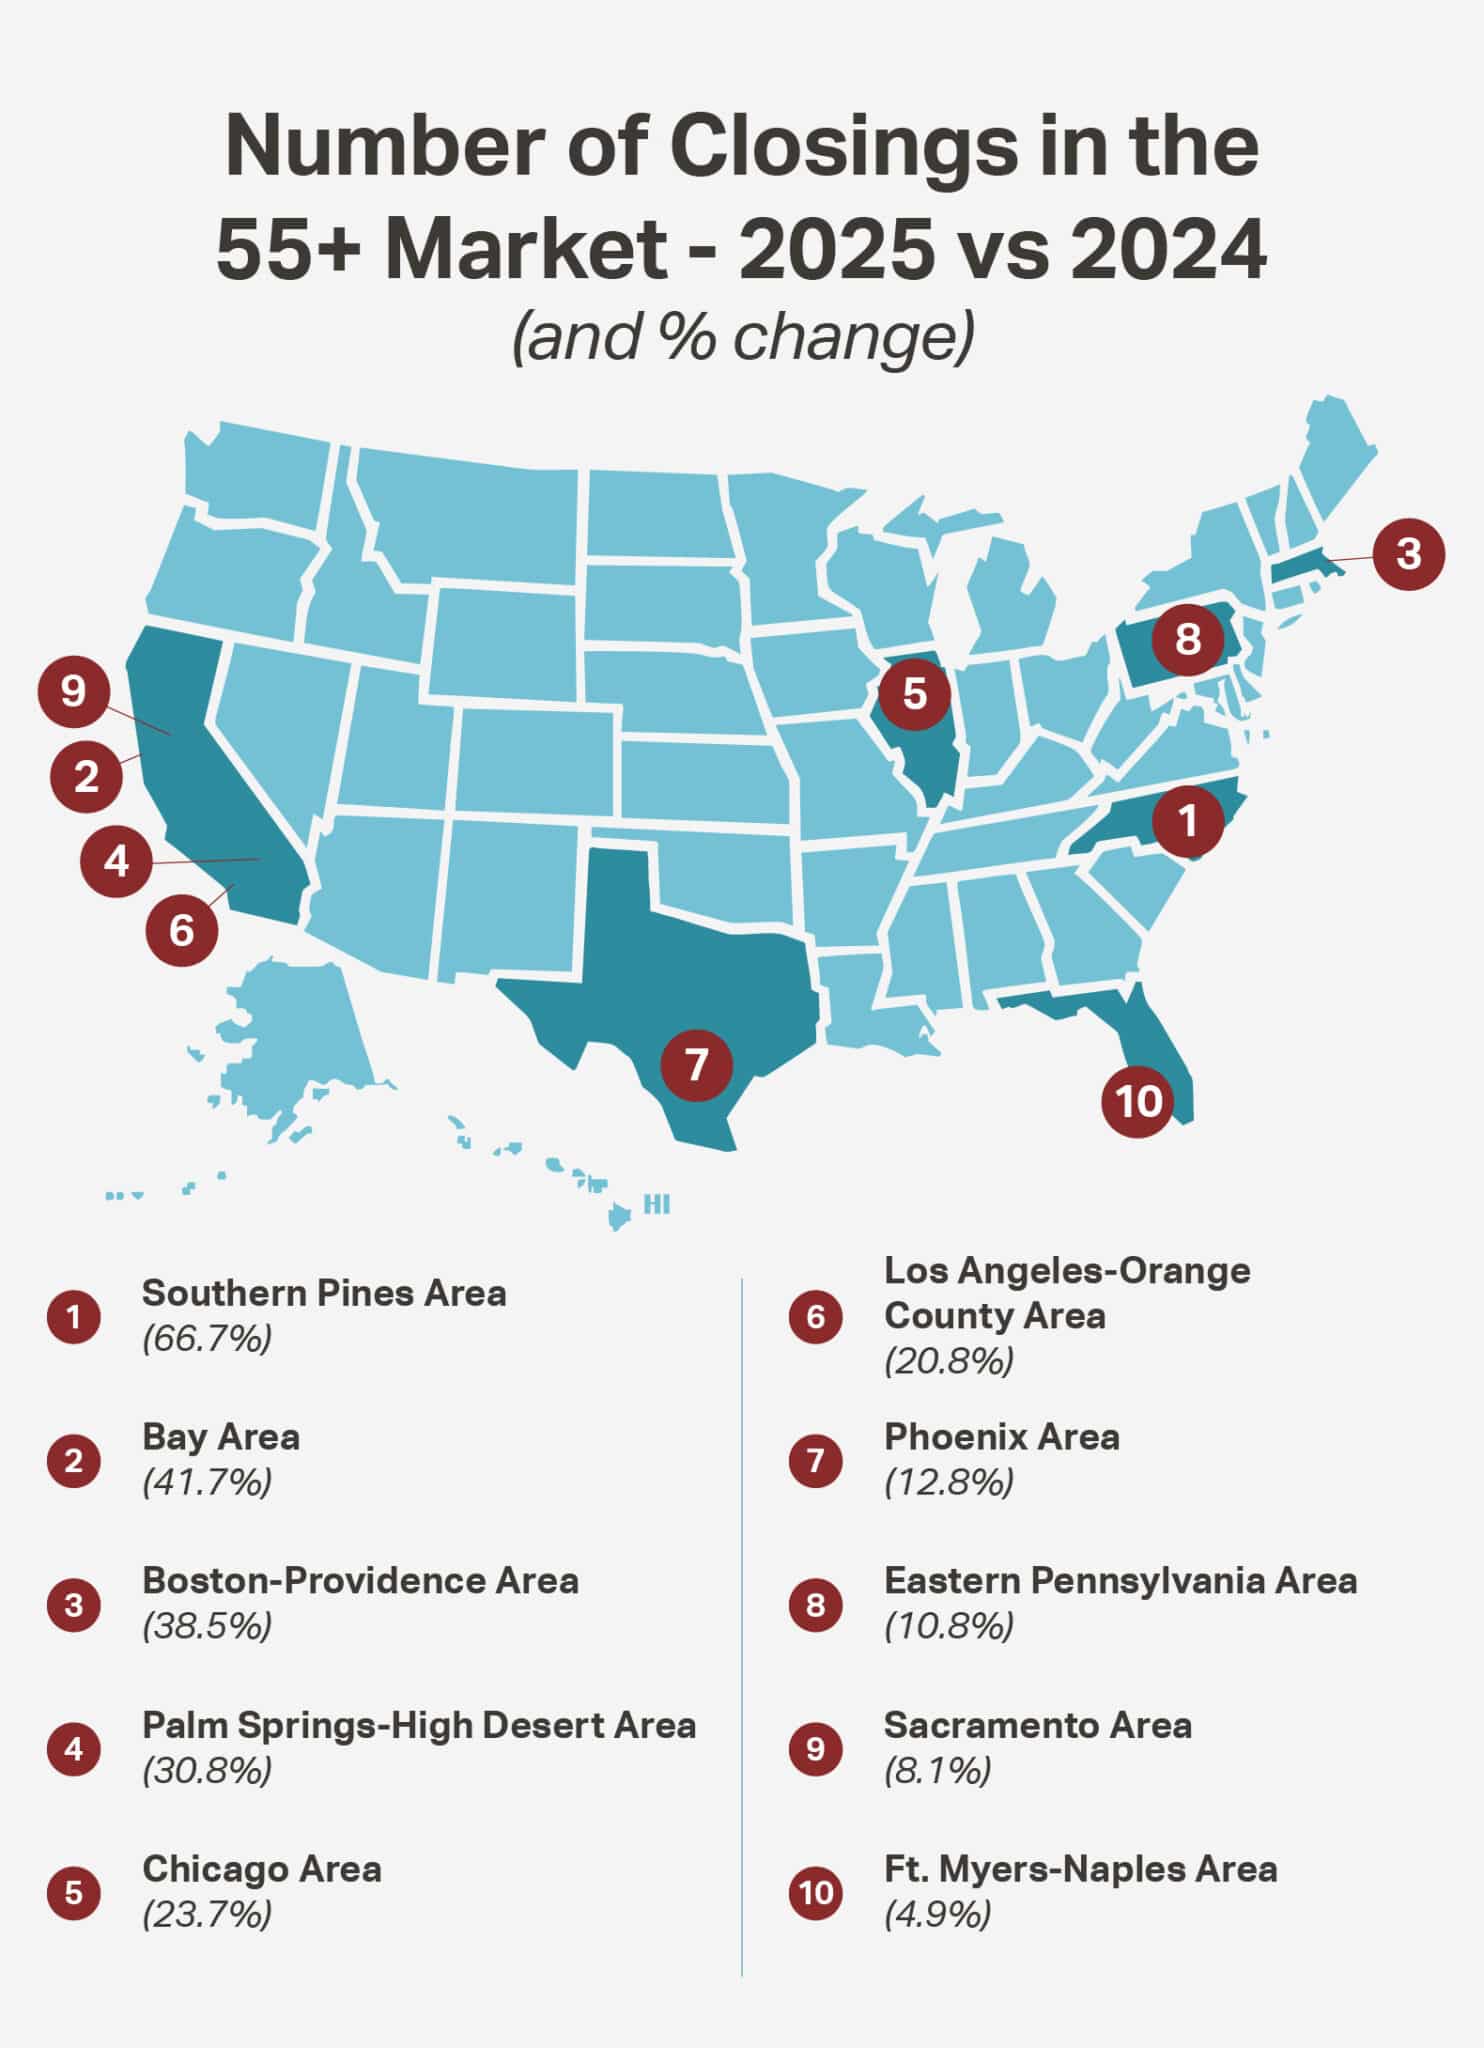
Over the past year, several 55+ markets across the U.S. have seen an uptick in closings. North Carolina’s Southern Pines area—popular for its golf courses—saw a huge spike in closings with a 66.7% increase compared to last year. California’s Bay Area also had an impressive increase in its number of closings with a 41.7% increase in the market.
Here’s a look at the top 10 55+ markets that saw the largest amount of closings in the past year:
Reasons for a Surge in Closings
Many factors can contribute to an increase in a market’s closing activity. For example, a sudden influx of retirees looking to relocate to a more tax-friendly state or snowbirds start buying homes in a market with a warmer climate to avoid harsh winters. Cash buyers looking to quickly take advantage of great deals in lower-priced markets can also have a significant impact on an area’s closings.
However, low costs and tax incentives aren’t the only reasons a market will experience a surge in closings. Higher-priced cities like Boston and the Bay Area repeatedly garner strong closing numbers because of the high demand to live in vibrant metro areas with limited housing supply. Homes will often sell quickly after being listed in these more competitive markets, leading to a surge of closings.
Markets Experiencing Price Declines
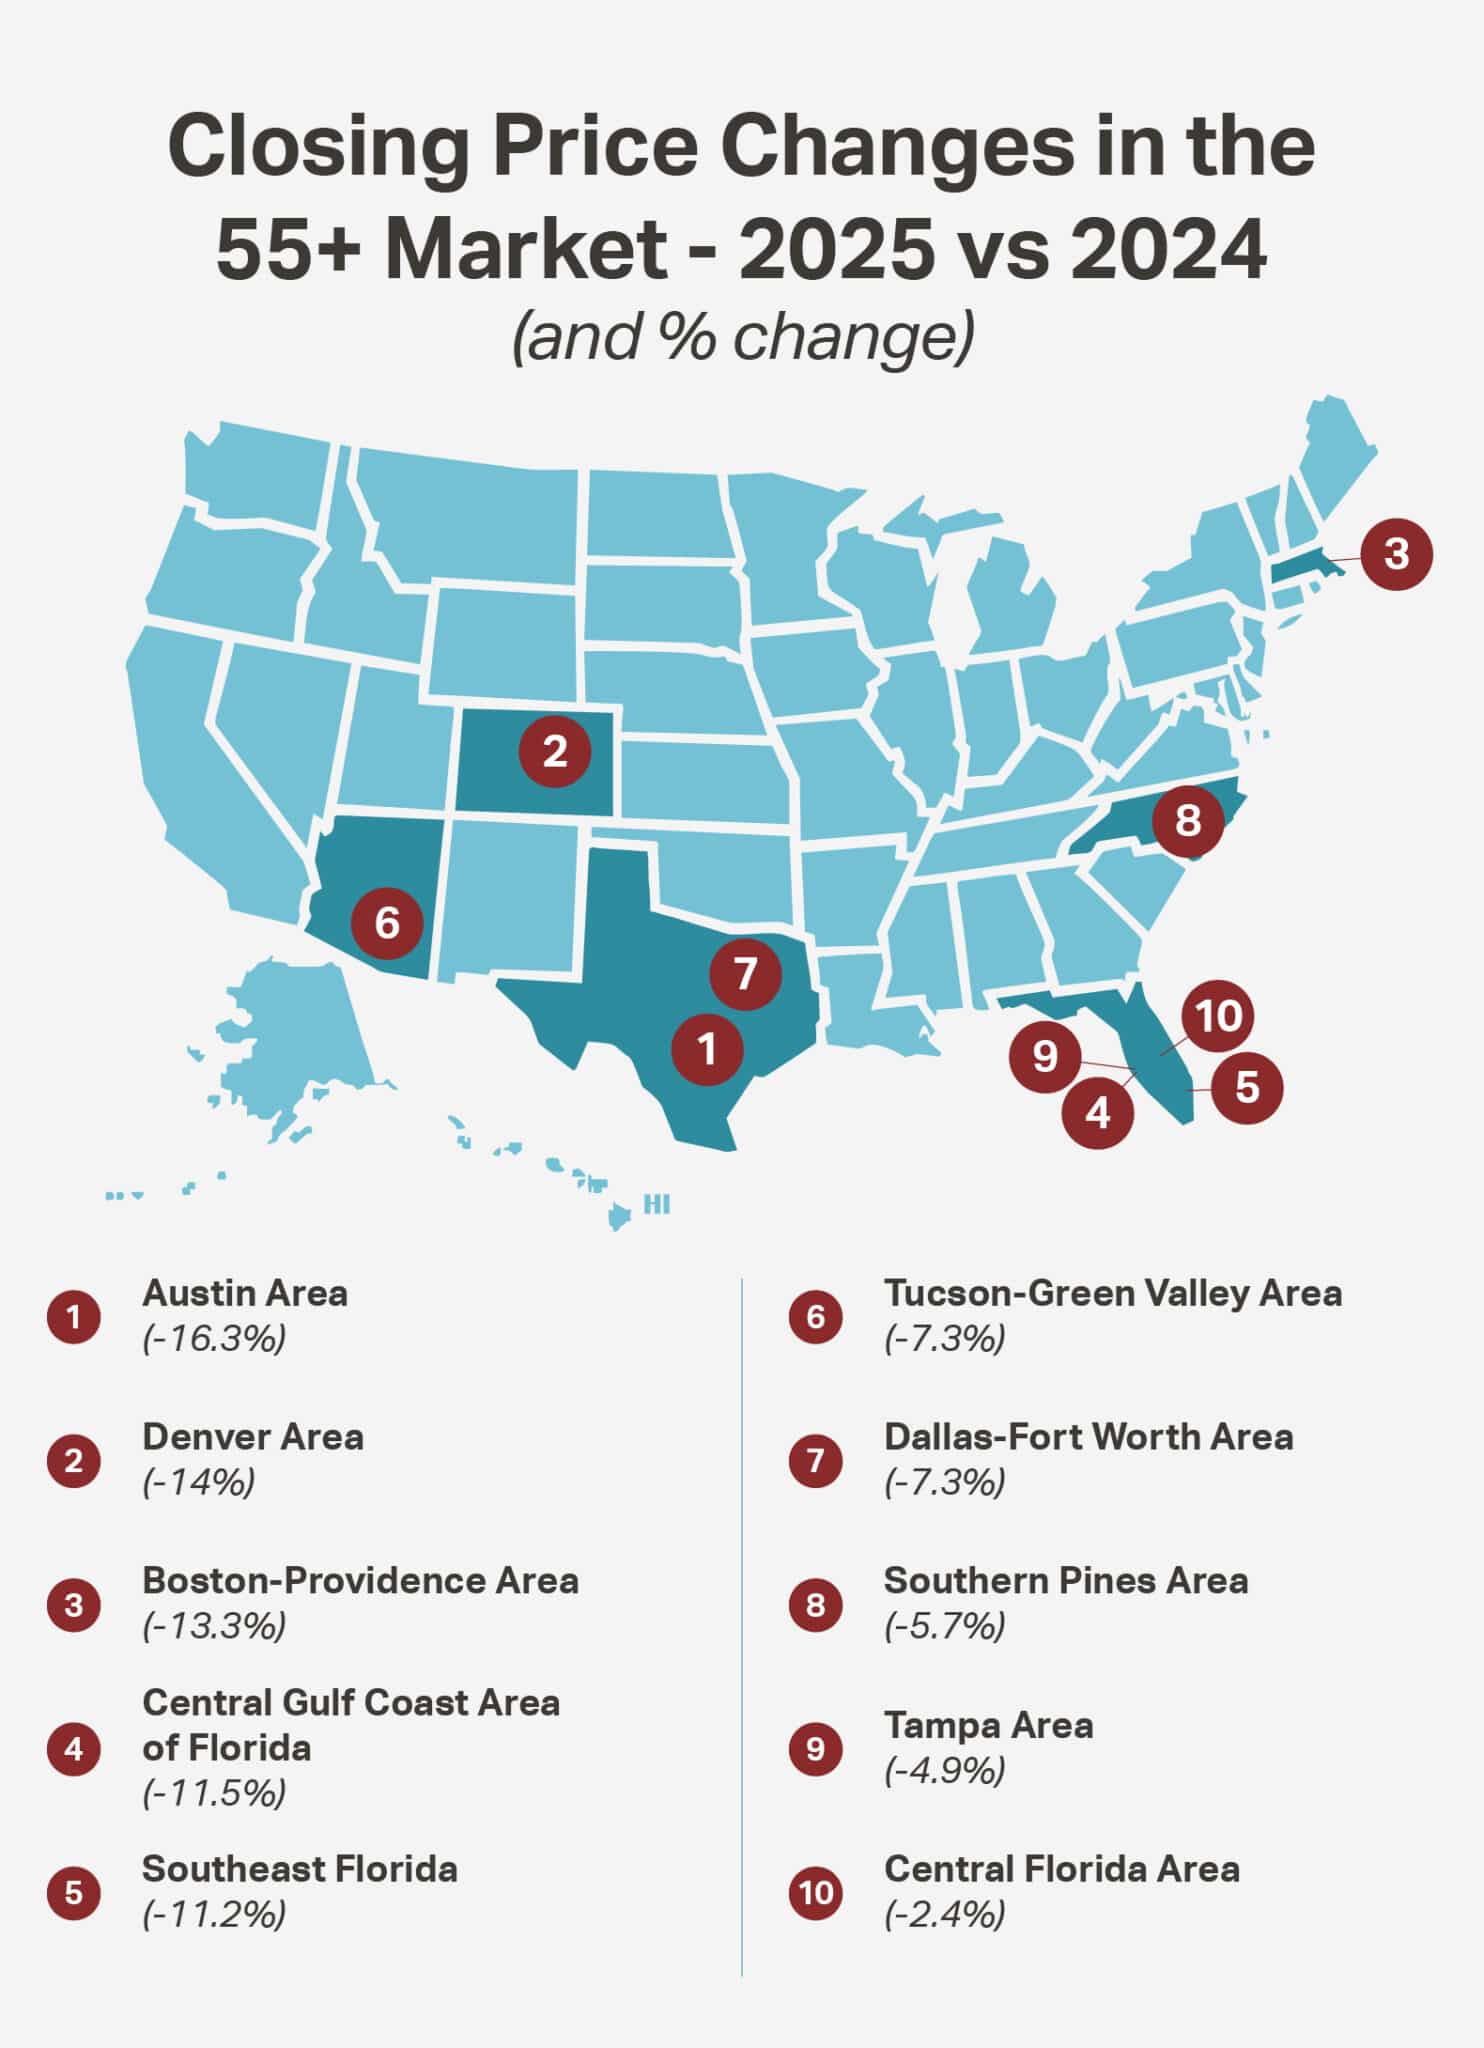
Though a variety of 55+ markets across the country saw an increase in prices and closings over the year, some areas experienced a decline in housing prices. Prospective buyers may want to pay close attention to cities like Austin and Denver, which both saw the steepest declines in housing prices in the 55+ market.
The Austin area experienced a 16.3% drop in prices, while Denver was close behind with a 14% decrease. While such significant price drops aren’t ideal for sellers who want to make a large profit, they can present opportunities for buyers, allowing them the chance to stretch their budgets further.
Here’s a look at the 55+ markets that saw the biggest decline in prices over the past year in the U.S.:
Florida’s Price Shifts: A Mixed Bag
Market shifts over the past year suggest that different parts of the Sunshine State are experiencing varying trends, with some areas facing challenges. Areas like Southeast Florida—which is home to 255 active adult communities—struggled with both a substantial increase in inventory and an 11.2% decline in pricing. Other Florida markets like Tampa and Central Florida only saw slight declines in those areas.
Though the state’s markets saw varying trends throughout the year, with some areas experiencing price declines, Florida’s desirable location, warm climate, and tax incentives will continue attracting retirees from colder, more expensive areas, helping to stabilize the market over time.
Key Takeaways for Buyers and Sellers

For Buyers: Where to Find the Best Opportunities
Based on the top 10 55+ market changes in the past year, buyers will find the best opportunities in places like Austin, Denver, and parts of Florida, including the Central Gulf Coast, Tampa, and Southeast Florida. With lower prices, these markets offer more value and more room to negotiate in your favor.
Buyers will find the largest variety of housing options in areas where there’s currently an abundance of listings on the market, such as Southeast Florida, the Ft. Myers-Naples Area, and the Central Gulf Coast Area of Florida. Other markets with high inventory to consider include Knoxville, the Delaware-Ocean City Area, and the Tucson-Green Valley Area. The excess inventory in these markets not only provides prospective buyers with more choices to consider but also affords them the ability to take the time they need to find the right home for their specific needs.
Big metro areas like Boston and Chicago still lean more toward a seller’s market with higher prices and limited offerings. Homebuyers in these areas should expect to move quickly on properties and possibly pay more than a listing’s asking price.
For Sellers: How to Price Strategically in a Shifting Market
A shifting market can be difficult for sellers to navigate especially when there are significant changes like a sudden influx of available inventory or a decline in prices. However, paying close attention to notable changes in the market can help you adjust your expectations.
In a shifting market, buyers will have more options to choose from, making it imperative for sellers to stay up-to-date on current median home prices in the area. Having a competitive price from the start will help attract more offers.
In addition to competitive pricing, there are several other strategies to help maximize your home’s value in the shifting market. Start by taking care of any obvious repairs around the house before putting it up for sale. Buyers will have more options to choose from in a shifting market and can afford to be more picky. You don’t want an easy repair that wasn’t fixed to cost you a sale. Also, be sure to highlight any special features or amenities on the property such as a pool and patio area. You may want to consider hiring a staging company to increase the property’s curb appeal. Paying attention to these details can make a big difference in helping you price your home accurately in a market shifting in favor of buyers.
The 55+ housing market is always evolving. So, keeping a watchful eye on the changes happening in areas that interest you can be extremely beneficial whether you’re navigating the buying process or planning to sell your home soon.
55places.com Is Here to Help You Navigate the 55+ Housing Market

Understanding the shifting trends in the 55+ housing market is key to making informed decisions about your next move. Whether you’re looking to buy, sell, or simply explore your options, 55places.com is here to help.
Our expert real estate agents specialize in active adult communities and can provide the insights you need to navigate the market with confidence. Contact us today to connect with an experienced agent who can guide you toward the perfect 55+ community for your lifestyle and goals!
Methodology
We analyzed data from over 70 Multiple Listing Services (MLSs), focusing on home sales in 2024 and 2025 within the geographic boundaries of more than 2,500 active adult communities listed on 55places.com. Most of these communities are age-restricted for residents 55 and older, in accordance with the Housing for Older Persons Act. We also included a small number of age-targeted communities—those designed to appeal to 55+ residents through their home designs, amenities, and lifestyle offerings, despite lacking formal age restrictions.
For each community, we aggregated key metrics, either summing or averaging values, to reflect trends within the broader “Area” they belong to.
While our methodology provides a comprehensive market overview, it does not account for transactions occurring outside the MLS. This includes many new construction home purchases made directly from builders, as well as private sales between friends or family members. Additionally, we excluded outliers to ensure the data remains relevant to the 55+ homebuying market.